


 Your new post is loading...

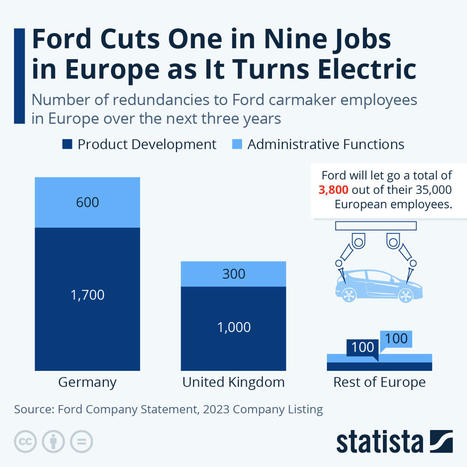

Ford, the U.S. car manufacturer, announced on Tuesday that it will be cutting nearly 4,000 jobs in Europe over the next three years as it hastens to transition from petrol and diesel engines to an all-electric fleet by 2035 while trying to remain competitive.
Ford’s announcement comes as the European Parliament gave its final stamp of approval on the 2035 deadline for the ban of new sales of carbon-emitting petrol and diesel cars.


Ha nem lehet több benzines és dízeles autót eladni Európában, akkor ezen a területen nincs szükség fejlesztésre. A termelést lehet a meglévő technológiával folytatni, miközben szépen, lassan leépítik.
Közel 4000 ember elküldését jelentették most be. Közülük 2800 dolgozik a gyártási területeken. Köln, Aachen (2300 fő, Németország), valamint Dunton és Essex (1300 fő, Egyesült Királyság) a fő vesztesek.
Az egyik ok az, hogy az elektromos motorok egyszerűbbek, mint a belső égésűek, így kevesebb ember kell az előállításukhoz.
A Bloomberg értesülései szerint: (https://www.bloomberg.com/news/articles/2023-02-14/ford-to-cut-3-800-jobs-in-europe-with-focus-on-germany-uk)
A Ford a következő években valószínűleg még tovább csökkenti a létszámot: a németországi Saarlouisban található, 4600 dolgozót foglalkoztató üzemében a tervek szerint 2025-ig megszűnik a Focus kompakt autók gyártása. A vállalat nem tervezi, hogy ezt követően más járműveket gyártana ott, és tárgyalásokat folytat az üzem potenciális vevőivel, köztük a kínai BYD Co.-val, az ügyet ismerő személyek szerint. (Ezt az utolsó bekezdést a www.DeepL.com/Translator fordította.)
#Ford #Germany #UK #UnitedKingdom #Köln #Aachen #Dunton #Essex #Saarlouis #firing #jobcut #electric #electricvehicle #EV #Cologne #statista.com #Bloomberg